


Page|36
Minutes:
The‘minutes’fieldcanonlybemodifiedifyouchooseaDataIntervalofUserDefined.Inthiscase,youcanspecify
howmanyminutesapartyouwishtoplacethedatapoints.Thechartcanonlybeaspreciseastheoriginal
recordinginterval.
Whenyouareusing
apre‐definedinterval(anyintervalotherthanUserDefined),theminutesfieldwillberead
onlyanddisplaythechosenintervalinminutes.
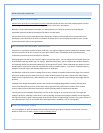
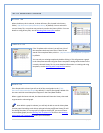
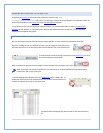
STATUS
ThestatussectionofthePropertieswindowtellsusifthedatatypeandintervalswehavechosenarevalid.Ifwe
haveselectedtodisplayadatatypeoratimeperiodthatisnotavailableinourdatarecords,thestatuslinewill
turnredtoindicatethatthe
datacannotbedisplayed.Ifourselectionsarevalid,thestatustextwillbegreen.
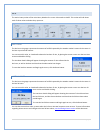
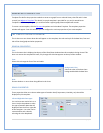
SAVINGATEMPLATEASAGRAPH
Todisplayweatherdatainachartofgraphformat,wefirstneedtoselectthehistorydataandcreateatemplate.If
youhavenotyetdonethis,pleaserefertothesectionsonWorkingwithHistoryFiles
andWorkingwithTemplates.
Youcanalsochoosetousethedemotemplatetogetsomepracticeworkingwithgraphs.
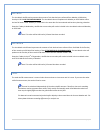
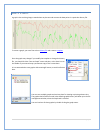
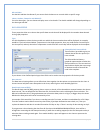
Oncewehaveselectedahistoryfile
andcreatedatemplate,adatachartorgraphisgeneratedanddisplayedin
theChart/Datawindow
.Atthispointhowever,thechartisstillconsideredatemplateandthepropertiescanbe
modifiedasneeded.
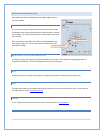
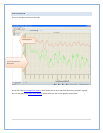
Wemaywanttosavea
permanentcopyofthis
chartforlateruse.When
wesaveatemplateasa
permanentcopy,it
isthen
referredtoasaGraph.
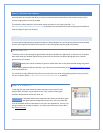
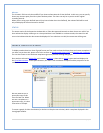
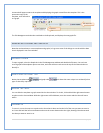
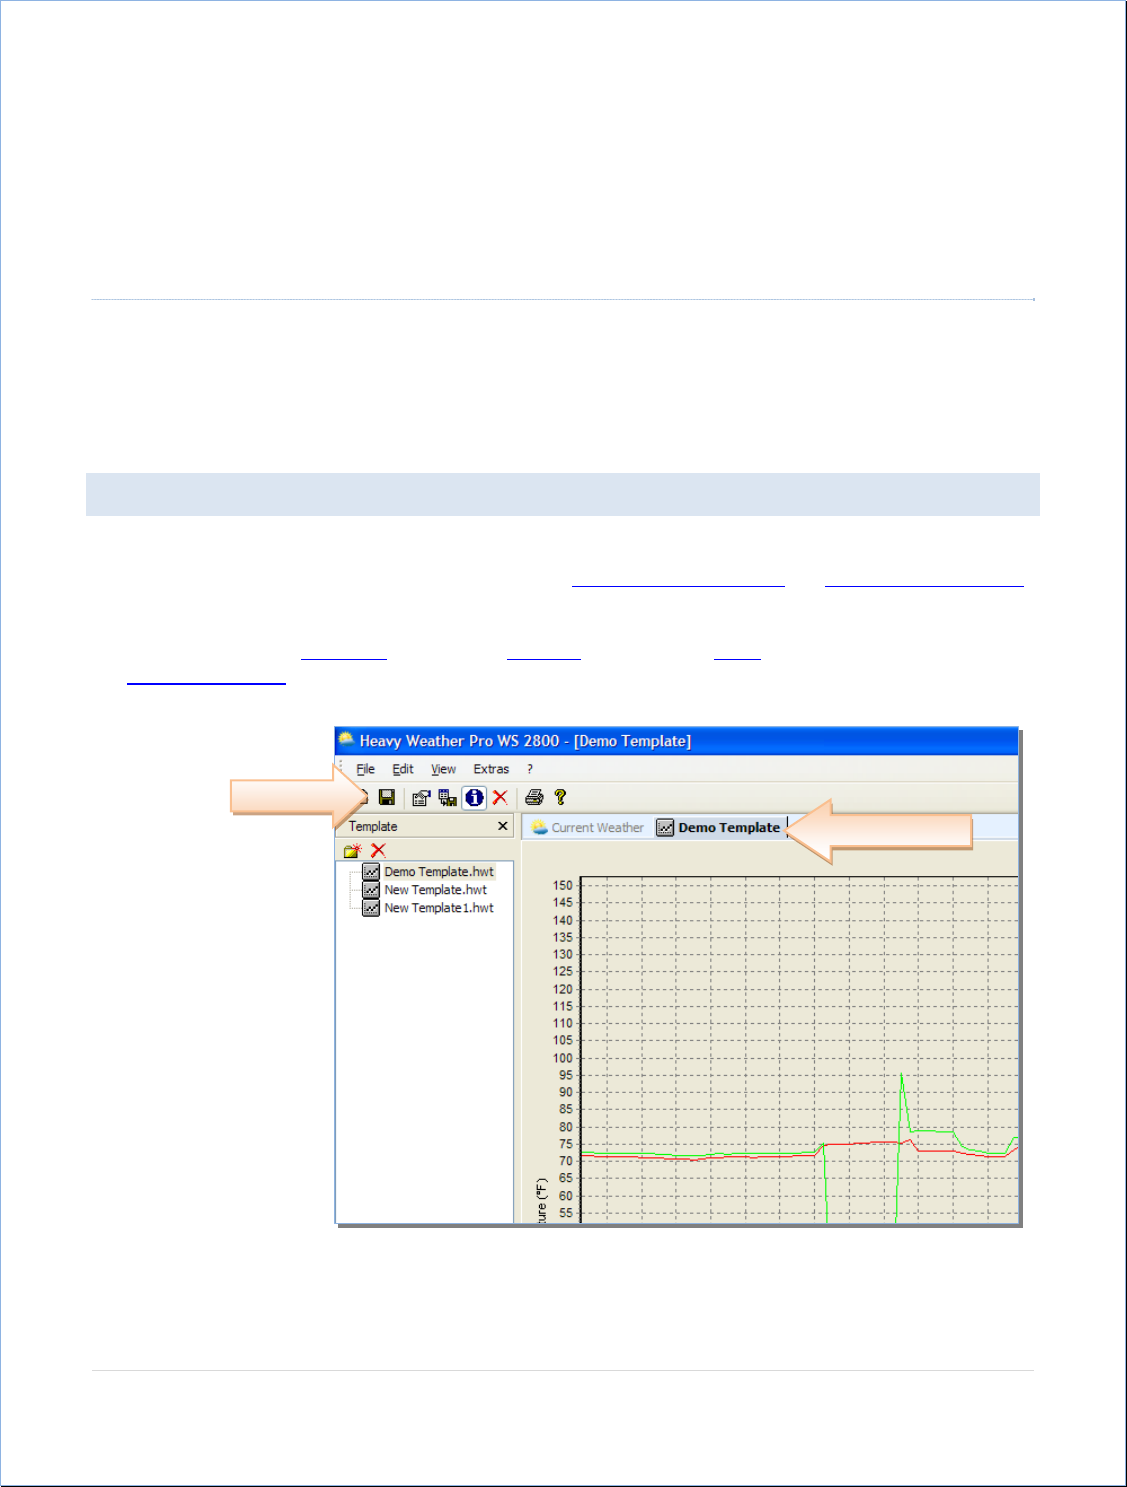
Tocreateagraph,clicktheSavebutton(ortheSaveasGraphmenuselection)whileatemplatedisplayedinthe
chart/graphwindow.
Stillatemplate…
Savebutton